
With England’s housing market eased out of lockdown on the 13th May, property marketing providers, BriefYourMarket.com has updated its analysis of on-market data from their software to establish how buyers and sellers are responding.
The data, which considers the combined activity of Rightmove and Zoopla in England and Wales, suggests that the pent-up demand previously seen at the start of 2020 is starting to resurface, with activity at its highest for new listings and SSTC (sold, subject to contract) since pre-lockdown.
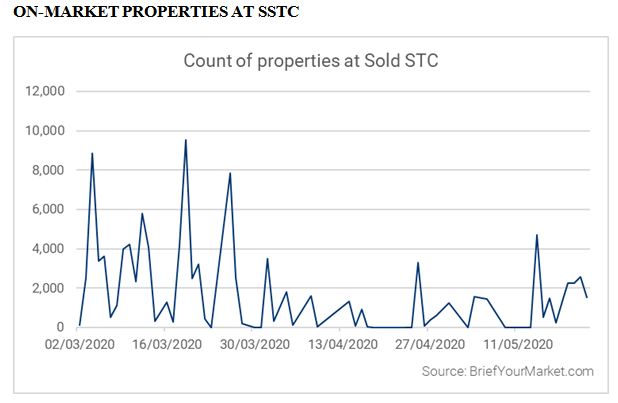
73,176 properties went SSTC in March.
15,463 in April.
20,037 from 1st to the 22nd May; with activity peaking on the 14th at 4,708.
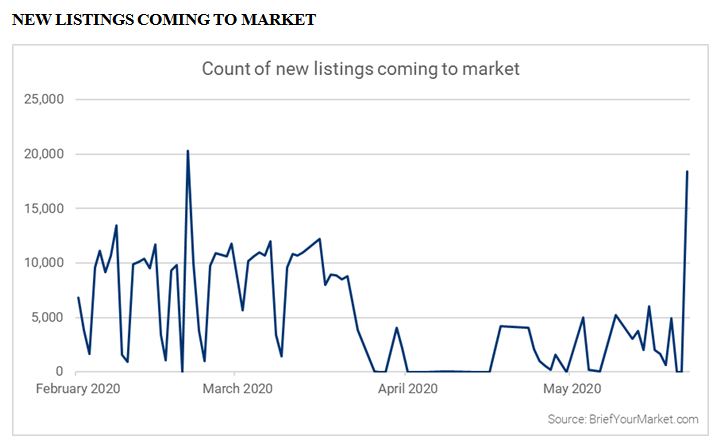 233,046 new listings in February.
172,708 in March.
13,688 in April.
52,862 up to 22nd May.
These latest figures demonstrate a healthy start to recovery, with new listings up 386% since April where activity had started bottoming out between the 1st and 17th [the exceptionally low volume does not show up on the graph].
From the 13th to the 19th May, 20,958 properties were listed for sale.
This surge in activity corresponds with England’s housing market reopening; meaning that just one week saw 53% more activity than for the whole of April.
On the 22nd May, an impressive 18,427 properties were listed ahead of the bank holiday weekend.
The closest comparison to this heightened activity happened on the 21st February at 20,326 new listings pre-lockdown, which could suggest a return of confidence from homeowners.
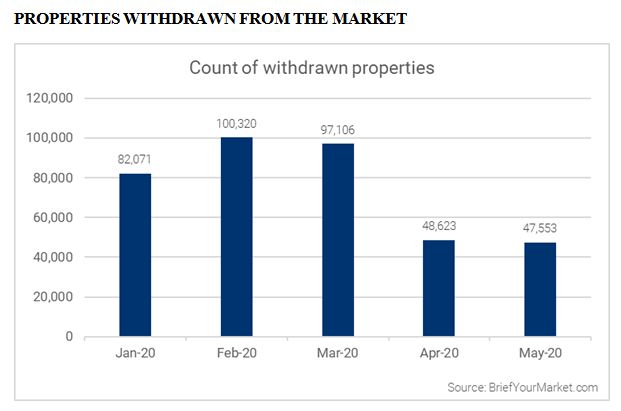
Activity for withdrawn properties has begun steadying, with reduced numbers that correspond to fewer new listings over this period. 48,623 in April and 47,553 in May (up to 22nd).
In terms of withdrawal trends, the average – prior to March – had been 78,865 properties per month.
If the current rate of withdrawals were to continue for the remaining week of May, the final monthly total could be up to 63,404 – which is just 20% less than the expected average.
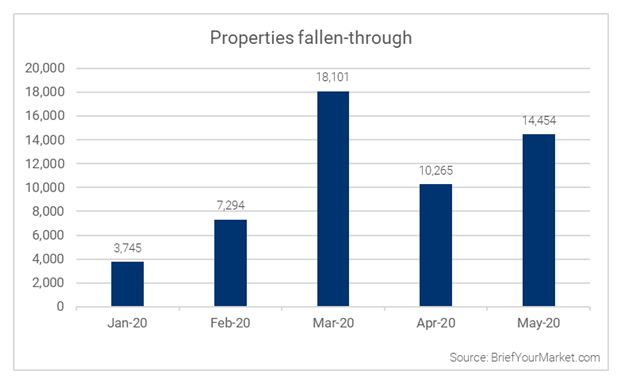
10,265 sales fell through in April – only 40% more than February, showing a gradual return to lower pre-lockdown levels.
This trend looked set to continue in May, with 2,332 fall-throughs between 1st and the 13th.
3,091 fall-throughs were recorded on the 14th May, followed by a further 9,031 over the course of the next week.
A possible explanation for this climb in fall-throughs is that with offices opening again, there’s been a discovery of chains falling through across England and Wales, causing a knock-on effect.


Comments (6)
Not sure the graphs support the headline. Why not wait a few days and publish the information for the whole of May. ? Then comparisons would be “Like for Like”
Would BriefYourMarket.com be so good as to confirm what their definition of a “new listing coming to market” is – and how do they validate that every “new listing” correctly meets that definition.
Thank you.
A new listing is a property that comes on Rightmove and/or Zoopla in England and Wales that is not a re-listing by the same or a new agent.
Thank you. How do you validate that it is not a #RElisting – either by the same Agent or by another?
And (on behalf of our Scots and Irish Agent readership) why don’t you include Scotland and NI?
My email address is richardc@briefyourmarket.co.uk drop me an email and i can answer all your queries for you
KR
Rich
email sent. Thank you.